A workplace can go months without a recordable injury and still have serious safety problems.

Machine guards may be damaged. Corrective actions may remain open. Employees may stop reporting near misses. Training may exist on paper without workers being able to demonstrate the required skill.

None of those conditions necessarily appear in an injury rate until something goes wrong.

This is why safety performance should not be measured with incident statistics alone.

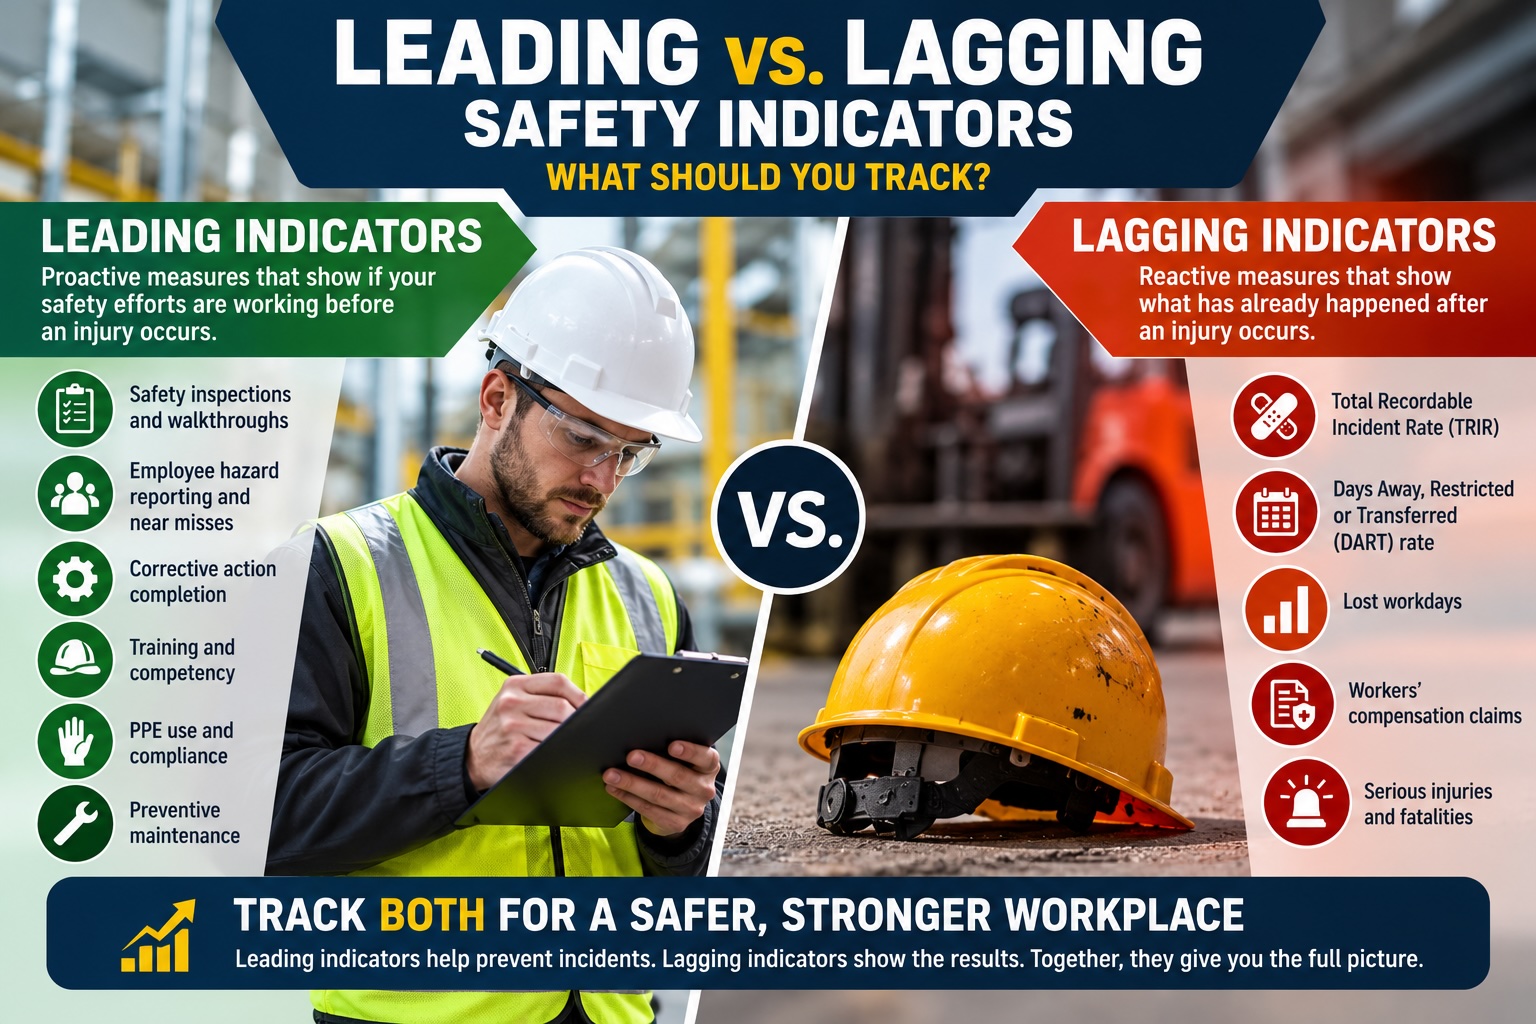
Lagging indicators such as injuries, lost workdays, workers’ compensation claims, and recordable incident rates show what has already happened. Leading indicators look earlier in the process by measuring whether inspections, training, hazard reporting, corrective actions, preventive maintenance, and other safety activities are actually working.

Employers need both.

The challenge is choosing indicators that reveal meaningful information instead of filling a dashboard with numbers that do not improve safety decisions.

What Are Leading and Lagging Safety Indicators?

Leading and lagging indicators look at safety performance from different points in time.

One measures prevention.

The other measures outcomes.

Leading Safety Indicators

Leading indicators are proactive measures that help an organization understand whether activities intended to prevent injuries are being completed effectively.

Examples can include:

Hazard inspections, near-miss reporting, corrective-action completion, employee safety participation, preventive maintenance, training competency, and PPE assessments.

These indicators can reveal weakness before an injury occurs.

If scheduled inspections begin falling behind or corrective actions remain open longer each month, management receives an early warning even if injury numbers remain unchanged.

Lagging Safety Indicators

Lagging indicators measure events that have already occurred.

They commonly include:

Recordable injuries, illnesses, lost workdays, restricted-duty cases, workers’ compensation claims, and fatalities.

These metrics remain valuable because they reveal actual harm and provide evidence about where safety systems have failed.

However, they are reactive.

By the time a lagging indicator changes, someone may already have been injured.

Why Employers Need Both Types

OSHA describes leading indicators as proactive and preventive measures that can reveal potential safety-program problems, while lagging indicators measure past injuries, illnesses, and other outcomes.

OSHA recommends using both rather than treating one category as a replacement for the other. (OSHA Leading Indicators)

That balance provides a more complete picture.

Leading indicators answer questions such as:

Are we doing the things that should prevent injuries?

Lagging indicators answer:

Are people still getting hurt?

If both sets of information are reviewed together, employers can determine whether safety activities are producing the desired results.


Explore Our Solutions!
Safety Training

Lagging Indicators Tell You What Has Already Happened

Traditional safety programs have relied heavily on injury statistics because they are easy to quantify and compare.

These metrics can show:

How many injuries occurred, how serious they were, whether workers missed time, and whether trends are improving or worsening.

They remain an important part of safety measurement.

The problem comes when employers treat them as the complete measure of workplace safety.

Total Recordable Incident Rate

Total Recordable Incident Rate, commonly called TRIR, is one of the most familiar lagging metrics.

It standardizes OSHA-recordable injuries and illnesses relative to hours worked so organizations can compare performance across different periods or operations.

A rising TRIR can indicate that workplace controls deserve closer review.

A falling TRIR can be encouraging.

But the number cannot explain by itself why performance changed.

An organization still needs incident investigations, hazard assessments, worker feedback, and other data to understand the causes.

DART Rate

DART refers to cases involving Days Away, Restricted, or Transferred because of a work-related injury or illness.

These incidents represent cases serious enough to interfere with an employee’s normal work.

Tracking DART can help employers understand whether injuries are affecting worker availability and operational continuity.

However, like TRIR, DART only changes after an injury has occurred.

It cannot show whether serious hazards are currently developing without producing injuries yet.

Lost Workdays

The amount of time employees spend away from work after injuries is another useful lagging measure.

Lost workdays can help show the operational impact of workplace incidents.

A small number of severe injuries may produce more disruption than a larger number of relatively minor cases.

Employers should therefore examine severity alongside injury count rather than relying on one number.

Workers’ Compensation Claims

Workers’ compensation data can provide another view of injury trends.

Useful information may include:

Claim frequency, type of injury, department, task, body part affected, and claim severity.

Claims data can help employers identify recurring patterns.

If several claims involve hand injuries around the same operation, the organization may need to examine guarding, work practices, glove selection, or training.

Arbill’s EHS safety assessments can help employers connect incident and claims information with actual workplace conditions, PPE, programs, and training gaps.

Why Low Injury Rates Do Not Automatically Mean the Workplace Is Safe

An organization can have excellent lagging indicators and still carry substantial risk.

There are several reasons.

Small Workforces Can Produce Unstable Rates

In a small workforce, injuries may be relatively rare simply because the number of hours worked is lower.

One serious injury can dramatically change the rate from one year to the next.

That makes lagging statistics especially volatile for smaller facilities.

A zero rate may therefore reflect limited exposure hours rather than strong hazard controls.

Employers should examine physical conditions and preventive activities rather than assuming that zero incidents proves the workplace is safe.

Serious Hazards Can Exist Without Producing an Injury

A forklift may repeatedly pass too close to pedestrians without striking anyone.

Employees may work beside an unguarded machine for months without an injury.

A fall-protection system may be used incorrectly without anyone actually falling.

Lagging indicators see none of these conditions.

Leading indicators can.

They give employers a way to measure the controls before the hazard produces an outcome.

Underreporting Can Distort Lagging Data

Low injury numbers can also become misleading when employees feel pressure not to report incidents.

This can happen when organizations place excessive emphasis on:

Zero-injury streaks, bonuses tied to injury counts, or discipline associated with reporting.

A workplace with fewer reported incidents is not necessarily a safer workplace.

It may simply have weaker reporting.

Safety metrics should encourage workers to report hazards, near misses, symptoms, and injuries rather than creating incentives to keep numbers artificially low.

Historical Performance Can Miss New Hazards

Lagging indicators describe the conditions that existed when previous incidents occurred.

Workplaces change.

New equipment arrives. Chemicals change. Contractors enter the facility. Production speeds increase. Layouts change. New employees begin unfamiliar tasks.

A strong three-year injury history cannot confirm that a recently introduced process is safe.

This is where leading indicators become especially useful.

What Should You Track as Leading Indicators?

Not every activity needs to become a metric.

The best leading indicators reflect important safety processes connected to the organization’s actual hazards.

A manufacturing facility may emphasize machine guarding and lockout/tagout.

A warehouse may focus on forklift traffic, racking, pedestrian separation, and slips.

A chemical operation may place more attention on PPE, exposure controls, chemical management, and emergency preparedness.

The dashboard should follow the risk profile.

Safety Walkthrough Findings

Routine inspections can provide valuable leading information.

Do not track only how many walkthroughs were completed.

Also consider:

How many serious hazards were identified, how quickly they were corrected, and whether the same conditions appear again.

An inspection completion rate of 100% means little if the inspections consistently fail to detect obvious hazards.

Quality matters as much as quantity.

Corrective-Action Completion

Corrective actions are one of the strongest indicators of whether a safety system responds to identified problems.

Useful measures can include:

Percentage completed on time, average days to closure, overdue high-risk actions, and percentage verified after completion.

This last metric is particularly important.

An action should not be considered successful merely because someone changed its status to “closed.”

”As long as people go to work, we have an opportunity to help protect them.

Julie Copeland
Arbill CEO

Julie Copeland Arbill CEO

Verify That Corrective Actions Actually Work

Suppose an audit identifies damaged racking.

Maintenance repairs it and closes the action.

At first glance, the metric looks good.

But if forklifts continue striking the same area, the underlying problem remains.

The organization may need to investigate:

Aisle width, vehicle routes, operator practices, rack protection, or congestion.

A stronger indicator therefore measures not only whether the repair was completed but whether the hazard stopped recurring.

Repeat Findings

Recurring audit findings are another useful leading indicator.

If the same problem repeatedly appears, previous corrective actions may have treated symptoms rather than causes.

Examples include:

Repeated blocked exits, recurring machine-guard damage, repeated PPE misuse, recurring chemical-label issues, or repeated forklift impacts.

Tracking repeat findings can help management distinguish permanent fixes from temporary cleanup.

Employee Hazard Reporting

The number of hazards employees report can provide useful information about worker participation.

However, more reports should not automatically be interpreted as worsening safety.

An increase may mean employees trust the reporting system more.

The more valuable question is what happens after the report is submitted.

Track:

Response time, percentage investigated, percentage corrected, and whether the employee receives feedback.

A large reporting volume with a growing backlog of unresolved issues signals a different problem.

Near-Miss Reporting

Near misses provide information about events that could have resulted in injury but did not.

They can expose high-potential risks long before those risks affect TRIR or DART.

For example, a dropped object that narrowly misses a worker may reveal weaknesses in overhead protection or material securing.

A forklift-pedestrian near miss may reveal poor traffic separation.

A chemical splash stopped by PPE may show that the process itself deserves review.

Employers should use near misses as learning opportunities rather than as evidence that someone needs to be punished.

Safety Assessment Findings

Formal assessments provide another source of leading indicators.

Employers can track:

High-risk findings, program gaps, PPE deficiencies, repeat findings, and time to corrective action.

Arbill’s EHS safety consulting can support organizations that need help translating assessments and compliance reviews into corrective actions and longer-term safety planning.

The value is not simply counting findings.

A high number of findings can actually be positive if the organization is becoming better at identifying hazards and then correcting them.

The trend needs context.

Training Competency

Training completion rates are common safety metrics.

They are useful, but attendance alone provides limited information.

A stronger leading indicator asks whether employees can demonstrate the skill.

For example:

Can employees perform the correct lockout sequence?

Can respirator users perform a seal check?

Can workers identify the correct PPE?

Can forklift operators demonstrate safe operation?

Can supervisors explain emergency procedures?

Arbill’s EHS safety training can help organizations move beyond simple attendance records toward practical workplace competency.

PPE Selection and Use

PPE programs generate several possible leading indicators.

These may include:

Correct PPE selection rates, proper-use observations, fit-testing completion, damaged PPE findings, and availability of approved equipment.

For example, a facility might have zero eye injuries while inspections reveal that workers frequently remove safety glasses.

The lagging metric looks excellent.

The leading metric shows risk.

This is precisely why both indicators matter.

Preventive Maintenance

Equipment failures can introduce serious hazards.

Tracking whether safety-critical maintenance is completed as scheduled can provide an early warning.

This may apply to:

Machine guards, ventilation systems, forklifts, alarms, emergency equipment, safety showers, fall protection, or other critical systems.

A growing backlog of preventive maintenance can indicate risk before the first equipment-related injury occurs.

Management Walkthroughs

Leadership participation can also serve as a leading measure.

Tracking management safety walkthroughs may show whether leaders are spending time in the workplace and engaging with workers about safety conditions.

Again, quantity alone is insufficient.

Ten walkthroughs that produce no follow-up may be less meaningful than two that identify and permanently correct important problems.

See Our Safety Services!
Leading vs. Lagging Safety Indicators

Safety Culture and Worker Participation

Some leading indicators can be qualitative as well as numerical.

Employee surveys, safety meetings, worker suggestions, and participation in JHAs or assessments can help reveal whether employees believe management will respond to safety concerns.

Arbill’s guide on how to improve safety culture in industrial workplaces explains why worker participation and management response are central to building stronger safety performance.

Leading Indicators Can Become Bad Metrics Too

Leading metrics are not automatically better simply because they are proactive.

They can become meaningless when organizations track activity without quality.

For example:

100% inspections completed sounds positive.

But what if the inspections identify no hazards because supervisors rush through them?

100% training completed sounds positive.

But what if workers cannot demonstrate what they learned?

95% corrective actions closed sounds positive.

But what if the same hazards return a month later?

Good indicators measure meaningful performance rather than administrative completion.

Connect Leading Indicators to Specific Risks

A facility should avoid choosing indicators simply because they are easy to count.

Instead, start with the hazards most capable of causing serious harm.

If forklift-pedestrian interaction is a top risk, possible metrics could include:

Proximity events, blocked walkways, traffic-control inspection results, or corrective actions involving vehicle routes.

If fall exposure is a major issue, track:

Fall-protection inspections, guardrail deficiencies, worker competency, anchor issues, or work-at-height audit findings.

The metric should help management understand whether controls for the risk are getting stronger or weaker.

Building a Balanced Safety Dashboard

A useful safety dashboard should provide enough information for management to understand both prevention activity and actual results without becoming overloaded.

A practical structure might include a small number of leading indicators alongside key lagging measures.

Lagging Measures

Organizations might track:

TRIR, DART, serious injuries, lost workdays, and workers’ compensation claims.

Leading Measures

The same dashboard might include:

Critical hazards identified, corrective actions completed and verified, near misses reported, worker concerns addressed, training competency, and preventive maintenance completion.

The exact combination should reflect the organization’s major hazards and goals.

Pair Leading and Lagging Measures

Indicators become more useful when employers examine relationships between them.

For example, a facility may see that corrective-action completion is declining while incident rates remain flat.

That should not be interpreted as proof that delayed corrections are harmless.

The leading indicator may be providing an early warning that the lagging indicator has not yet captured.

Conversely, strong leading indicators combined with rising injuries should trigger a different question:

Are we measuring the right activities?

The organization’s prevention work may look good on paper while failing to address the hazards actually causing injuries.

Establish Baselines Before Setting Targets

Targets become more meaningful after employers understand current performance.

Measure indicators for several months to establish a baseline.

Then set improvement goals that are realistic and connected to risk.

For example, an organization might aim to reduce average corrective-action response time or increase the percentage of high-risk findings verified after completion.

Avoid setting targets that unintentionally discourage reporting.

A target such as “reduce near-miss reports” may create exactly the wrong behavior.

The better goal may be faster investigation and correction of reported near misses.

Assign Ownership

Every safety metric should have an owner.

Someone needs to know:

Where the data comes from, how often it is updated, how it is calculated, and whether the information is accurate.

Without ownership, dashboards can become collections of outdated numbers.

Metrics may also be calculated differently between departments, making comparisons unreliable.

Standard definitions improve consistency.

Review Safety Data Regularly

A dashboard should support decisions, not simply appear in management reports.

Review the indicators on a regular schedule.

For many organizations, monthly review may be appropriate.

Higher-risk operations may examine some leading indicators more frequently.

When a metric moves in the wrong direction, determine why.

If hazard-report response time is increasing, investigate workload or accountability.

If repeat audit findings are increasing, review root-cause analysis and corrective-action quality.

If worker participation drops, ask employees what changed.

Use Trends Instead of Isolated Numbers

A single month can be misleading.

Look for direction over time.

One delayed corrective action may not indicate a system problem.

A six-month trend of increasing closure time probably deserves attention.

Similarly, one month with no near-miss reports might appear positive.

Several months of zero reports in a high-hazard operation may raise questions about whether workers feel comfortable reporting them.

Trend analysis adds context to individual numbers.

Use Indicators to Guide the Safety Roadmap

The purpose of safety measurement is improvement.

Dashboard findings should feed back into broader planning.

If training competency continues declining, the organization may need to redesign training.

If repeated audit findings involve PPE, the issue may involve product selection, accessibility, or supervision.

If workers consistently report the same vehicle hazard, facility layout may need modification.

Arbill’s safety programs can help organizations create more structured systems around safety responsibilities, compliance, and ongoing improvement.

Do Not Chase a Perfect Number

Safety dashboards can create problems when leadership becomes more focused on the metric than the reason for measuring it.

A zero may not always be desirable.

Zero injuries is obviously the goal.

Zero near-miss reports may not be.

Zero identified hazards may mean inspections are weak.

Zero employee concerns may mean employees are afraid to report them.

Indicators need interpretation.

The question should always be:

What does this number tell us about actual risk?

A Practical 2026 Safety Dashboard

An industrial employer could build a balanced dashboard around several categories.

Outcomes

Track recordable injuries, DART cases, serious incidents, lost workdays, and relevant workers’ compensation trends.

Hazard Identification

Track high-risk hazards found during assessments, near misses, repeat findings, and employee-reported concerns.

Corrective Action

Track actions completed by target date, average closure time, high-risk overdue actions, and corrections verified as effective.

Training

Track required training completion but add competency checks where appropriate.

PPE

Track correct PPE use, fit-testing requirements, inspection findings, and recurring equipment problems.

Worker Participation

Track reporting activity, employee involvement, and management response time.

This provides a much clearer picture than one incident rate alone.

What Should Employers Track First?

Organizations that are just beginning to use leading indicators do not need dozens of metrics.

Start with a few measures connected to the organization’s highest risks.

A good starting point may be:

One or two lagging indicators, one hazard-identification indicator, one corrective-action indicator, one training or competency measure, and one worker-participation measure.

Review whether each metric helps management make a decision.

If the number changes and nobody knows what action to take, reconsider whether it belongs on the dashboard.

Conclusion

Lagging safety indicators remain important because employers need to understand how many injuries occurred, how serious they were, and what impact they had on workers and operations.

But those numbers describe the past.

They cannot show every uncontrolled hazard, near miss, overdue corrective action, training weakness, or breakdown in employee participation that may be developing today.

Leading indicators fill that gap by measuring the activities and controls intended to prevent injuries before they happen.

The strongest safety dashboards combine both.

Track outcomes such as TRIR, DART, lost workdays, and claims while also monitoring hazard identification, worker reporting, corrective-action effectiveness, training competency, PPE performance, and preventive maintenance.

Most importantly, focus on quality.

Completing an inspection is less important than whether it finds hazards.

Closing a corrective action is less important than whether the hazard stays corrected.

Finishing training is less important than whether the worker can perform the task safely.

When employers connect leading and lagging indicators in this way, safety measurement becomes more than reporting past performance. It becomes a practical tool for identifying risk early and improving the workplace before an injury occurs.

Request a Safety Assessment

Recent Posts

Safety Training
Leading vs. Lagging Safety Indicators: What Should You Track?

Leading vs. Lagging Safety Indicators: What Should You Track?

How to Conduct a Job Hazard Analysis - Your Complete Risk Assessment
What Is a Job Hazard Analysis (JHA) and How Do You Conduct One?

What Is a Job Hazard Analysis (JHA) and How Do You Conduct One?

How to Conduct a Workplace Safety Audit

How to Conduct a Workplace Safety Audit

Hard Hats vs. Safety Helmets
Safety Helmets vs. Hard Hats: What Employers Need to Know

Safety Helmets vs. Hard Hats: What Employers Need to Know

How to Choose the Right Chemical-Resistant Gloves for the Job

How to Choose the Right Chemical-Resistant Gloves for the Job

  • Next ProjectWhat Is a Job Hazard Analysis (JHA) and How Do You Conduct One?

CUSTOMER SERVICE

800-523-5367

CONTACT US

Complete the short form below and an Arbill representative will get back to you within 24 hours.
* Required Fields

    ARBILL RESPECTS YOUR PRIVACY AND YOUR INFORMATION: By submitting the form above you agree to receiving emails from Arbill. Your submitted information is NEVER shared. You may unsubscribe at any time via the "unsubscribe" link in our emails. You can view our Privacy Policy HERE.